Chart
The Chart is one of the available Display types, and it provides different options for visualizing your data in Angles for SAP.
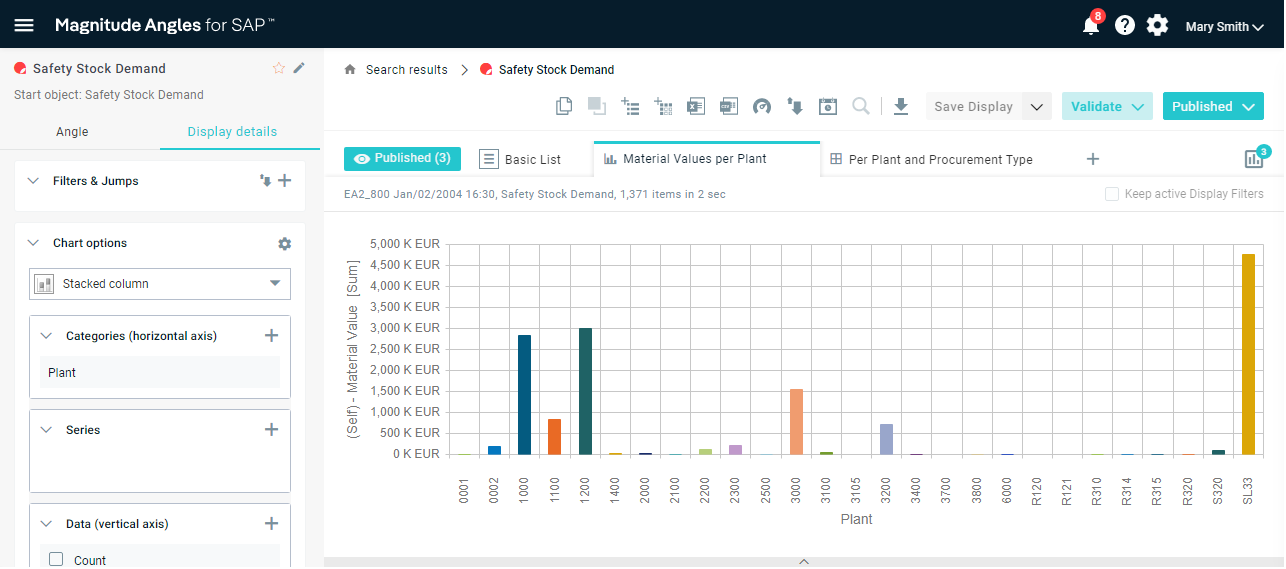
The vertical axis of a Chart shows the data that you are interested in. The horizontal axis displays the category of the data. The resulting Chart shows the data series.
With a Chart, you can do the following:
Use different Chart types for visualizing your data (see Changing the type of a Chart).
Perform a Drilldown on a Chart element to view the underlying raw data in a separate Display (see Drilling down).
Select the required grouping of the data (bucket) for the horizontal axis, depending on the data type of the category (see Editing the content of a Chart).
Change the category to a new one. For your convenience, a number of useful categories are suggested (see Editing the content of a Chart).
Change the data in the vertical axis (see Editing the content of a Chart).
Edit the Chart characteristics, for example, whether you want to display the axis titles and values, show the legend, etcetera (see Editing the Chart Display options).
Sort the data in the Chart (see Sorting the data in a Chart).
Zoom in on your area of interest, or zoom out to see the whole data set (see Zooming in or out).
Select the Excel template you want to use when exporting the data to Excel (see Exporting to Excel).